Sunday, December 9, 2018

How to run a study that doesn't replicate, experimental design edition

(tl;dr: Design features of psychology studies to avoid if you want to run a good study!)

Imagine reading about a psychology experiment in which participants are randomly assigned to one of two different short state inductions (say by writing a passage or unscrambling sentences), and then outcomes are measured via a question about an experimental vignette. The whole thing takes place in about 10 minutes and is administered through a survey, perhaps via Qualtrics.

The argument of this post is that this experiment has a low probability of replicating, and we can make that judgment purely from the experimental methods – regardless of the construct being measured, the content of the state induction, or the judgment that is elicited. Here's why I think so.

Friday was the last day of my graduate class in experimental methods. The centerpiece of the course is a replication project in which each student collects data on a new instantiation of a published experiment. I love teaching this course and have blogged before about outcomes from it. I've also written several journal articles about student replication in this model (Frank & Saxe, 2012Hawkins*, Smith*, et al., 2018). In brief, I think this is a really fun way for student to learn about experimental design and data analysis, open science methods, and the importance of replication in psychology. Further, the projects in my course are generally pretty high quality: they are pre-registered confirmatory tests with decent statistical power, and both the paradigm and the data analysis go through multiple rounds of review by the TAs and me (and sometimes also get feedback from the original authors).

Every year I rate each student project on its replication outcomes. The scale is from 0 to 1, with intermediate values indicating unclear results or partial patterns of replication (e.g., significant key test but different qualitative interpretation). The outcomes from the student projects this year were very disappointing. With 16/19 student projects finished, we have an average replication rate of .31. There were only 4 clear successes, 2 intermediate results, and 10 failure. Samples are small every year, but this rate was even lower than we saw in previous samples (2014-15: .57, N=38) and another one-year sample (2016: .55, N=11).

What happened? Many of the original experiments followed part or all of the schema described above, with a state induction followed by a question about a vignette. In other words, they were poorly designed.

Friday, September 7, 2018

Scale construction, continued

For psychometrics fans: I helped out with a post by Brent Roberts, "Yes or No 2.0: Are Likert scales always preferable to dichotomous rating scales?" This post is a continuation of our earlier conversation on scale construction and continues to examine the question of if – and if so, when – it's appropriate to use a Likert scale vs. a dichotomous scale. Spoiler: in some circumstances it's totally safe, while in others it is a disaster!

Thursday, August 30, 2018

Three (different) questions about development

(tl;dr: Some questions I'm thinking about, inspired by the idea of studying the broad structure of child development through larger-scale datasets.)

My daughter, M, started kindergarten this month. I began this blog when I was on paternity leave after she was born; the past five years have been an adventure and revolution for my understanding of development to watch her grow.* Perhaps the most astonishing feature of the experience is how continuous, incremental changes lead to what seem like qualitative revolutions. There is of course no moment in which she became the sort of person she is now: the kind of person who can tell a story about an adventure in which two imaginary characters encounter one another for the first time,** but some set of processes led us to this point. How do you uncover the psychological factors that contribute to this kind of growth and change?

My lab does two kinds of research. In both my hope is to contribute to this kind of understanding by studying the development of cognition and language in early childhood. The first kind of work we do is to conduct series of experiments with adults and children, usually aimed at getting answers to questions about representation and mechanism in early language learning in social contexts. The second kind of work is a larger-scale type of resource-building, where we create datasets and accompanying tools like Wordbank, MetaLab, and childes-db. The goal of this work is to make  larger datasets accessible for analysis – as testbeds for reproducibility and theory-building.

Each of these activities connects to the project of understanding development at the scale of an entire person's growth and change. In the case of small-scale language learning experiments, the inference strategy is pretty standard. We hypothesize the operation of some mechanism or the utility of some information source in a particular learning problem (say, the utility of pragmatic inference in word learning). Then we carry out a series of experiments that shows a proof of concept that children can use the hypothesized mechanism to learn something in a lab situation, along with control studies that rule out other possibilities. When done well, these studies can give you pretty good traction on individual learning mechanisms. But they can't tell you that these mechanisms are used by children consistently (or even at all) in their actual language learning.

In contrast, when we work with large-scale datasets, we get a whole-child picture that isn't available in the small studies. In our Wordbank work, for example, we get a global picture of the child's vocabulary and linguistic abilities, for many children across many languages. The trouble is, it's very hard or even impossible to find answers to smaller-scale questions (say, about information seeking from social partners) in datasets that represent global snapshots of children's experience or outcomes. Both methods – the large-scale and the small-scale – are great. The trouble is, the questions don't necessarily line up. Instead, larger datasets tend to direct you towards different questions. Here are three.

Friday, August 10, 2018

Where does logical language come from? The social bootstrapping hypothesis

(Musings on the origins of logical language, inspired by work done in my lab by Ann Nordmeyer, Masoud Jasbi, and others).

For the last couple of years I've been part of a group of researchers who are interested in where logic comes from. While formal, boolean logic is a human discovery*, all human languages appear to have methods for making logical statements. We can negate a statement ("No, I didn't eat your dessert while you were away"), quantify ("I ate all of the cookies"), and express conditionals ("if you finish early, you can join me outside.").** While boolean logic doesn't offer a good description of these connectives, natural language still has some logical properties. How does this come about? Because I study word learning, I like to think about logic and logical language as a word learning problem. What is the initial meaning that "no" gets mapped to? What about "and", "or", or "if"?

Perhaps logical connectives are learned just like other words. When we're talking about object words like "ball" or "dog," a common hypothesis is that children have object categories as the possible meanings of nouns. These object categories are given to the child by perception*** in some form or other. Then, kids hear their parents refer to individual objects ("look! a dog! [POINTS TO DOG]"). The point allows the determination of reference; the referent is identified as an instance of a category, and – modulo some generalization and statistical inference – the word is learned, more or less.****

So how does this process work for logical language? There are plenty of linguistic complexities for the learner to deal with: Most logical words simply don't make sense on their own. You can't just turn to your friend and say "or" (at least not without a lot of extra context). So any inference that a child makes about the meaning of the word will have to involve disentangling that from the meaning of the sentence as a whole. But beyond that, what are the potential targets for the meaning of these words? There's nothing you can point to out in the world that is an "if," an "and," or even a "no."

Monday, June 18, 2018

What does it mean to get a degree in psychology these days?

(I was asked to give a speech yesterday at Stanford's Psychology commencement ceremony. Here is the text). 

1. Chair, Colleagues, graduates of the class of 2018 – undergraduates and graduate students – family members, and friends. It’s a pleasure to be here today with all of you. Along with honoring our graduates, we especially honor all the wonderful speakers today for their accomplishments – MH for his excellence in research and teaching, Angela for her deep engagement with the department community. You could be forgiven for thinking that there was some special achievement that brought me here as well. In fact, by tradition, faculty take turns addressing the graduating class and is my turn this year. It’s a real pleasure to have one last chance to address you.

Two weeks ago, my daughter Madeline graduated from preschool. There was cake; photos were taken. They broke a piñata. It was a big deal! Several of her friends will be going to different schools, some moving away to other states or even other countries. This is one of the biggest changes she’s ever experienced. I’m already worried about what happens next. Parents, I can only imagine what you are going through today – but at least you know that your kids made it through the first day of kindergarten.

Graduates - Your graduation from Stanford today is a really big deal. You also get to have cake and photos. If you’re very lucky, some special person has even bought you a piñata. But more importantly, just like for Madeline this is a time of transitions. You may be moving somewhere new. Even if you are staying here, friends will be further away than the next dorm or the next office. So do not hesitate to take a little extra time today to celebrate with the people you love and who love you.

Congratulations.

2. I want to take a little time now to think about what it means to get a degree in psychology from Stanford.

When you sit next to someone on an airplane and tell them you are studying psychology, perhaps they ask you if you are reading their mind. Perhaps they wonder if you are studying Freudian analysis and have thoughts about their unconscious, or their relationship with their mother. Or maybe they are more up to date and wonder if you study psychological disorders as they manifest themselves in the clinic. But the truth is, knowing what you’ve done in your degrees here at Stanford, you probably haven’t done too much Freud. Or too much mind-reading. And although you may be interested in clinical work (and this is laudable), that’s not the core of what we teach here.

Gaining a degree in psychology also means that you have gone to many classes in psychology and learned about many studies – from social influence to stereotype threat, from mental rotation to marshmallow tests. Although this body of knowledge is a lovely thing to have come into contact with (and I hope that you continue to deepen your knowledge), knowing this content is also not the core of what it means to receive your degree.

What you have learned instead are tools; a specific kind of tools, namely tools for thought. These tools can be used to approach problems and construct solutions. This is what it means for psychology to be an academic discipline: a discipline denotes a particular mental toolbox. The university is the intellectual equivalent of a construction firm – different departments have the tools to solve different sorts of problems.

3. Like nearly all ideas, “cognitive tools” seem obvious – after you are used to them. Let’s take one example, a foundational cognitive tool that we use every single day: numbers. Because we are so numerate, a lot of people have the idea that numbers are easy and straightforward. But they aren’t.

Take the preschoolers in Madeline’s old classroom. Nearly all of them can count, at least to ten and maybe higher. But if you probe a bit more deeply, it all falls apart. If at snack time, you ask someone to give you exactly four cheerios, she’s liable to hand you seven, or a whole handful. Even when a child knows that “one” means exactly 1, it takes quite a few months for them to figure out that “two” means exactly 2, and more months for 3. When they finally figure out how the whole system works it enables so many new things! Madeline owes all of her dessert-negotiation prowess to her abilities with numbers. Seven gummi bears? No. How about six? This idea of exact comparison is a skill – even though it makes for tiresome after-dinner conversation.

Numbers are an invented, culturally-transmitted tool. In graduate school I worked with an Amazonian indigenous group, the Pirahã, who have no words for numbers. They are bright, sophisticated people who love a good practical joke. Many Pirahã can shoot a fish with an arrow while standing in a canoe. Yet because their language does not have these particular words in it – words like “seven” - and because they do not go through that laborious period of practice that Madeline and other kids learning languages like English do – they can’t remember that it’s exactly seven gummi bears. To them, six or eight seems like the same amount. They simply don’t have the tool.

4. So what are the tools of the psychologist?

There’s one tool that qualifies as the hammer of psychology – the single tool you can use to frame an entire house. That’s the experiment. The fundamental insight of all of modern psychology is that the puzzles of the human mind can be understood as objects of scientific study if we can design appropriately controlled experiments. As complicated and unpredictable as people are (especially when they are integrated into complex cultural systems), we can still learn about their inner workings via experiments.

This insight has spread far outside of psychology and far outside of the academy. Nowadays, Facebook runs a hundred experiments a day on you. Governments and political campaigns, startups and not-for-profits are all constantly experimenting to try to understand how to achieve their goals. There is a good chance that in the next few years of your professional life you will face a complicated human problem with an unknown solution. The psychologist’s approach will serve you well: formulate a hypothesis about how you should manipulate the world; then assess whether the manipulation has changed your measurement of interest. This strategy is shockingly effective.

But the serious carpenter has other, more specialized tools in the toolkit – the plane, awl, rasp, drawknife, jigsaw, bevel. Let me mention two more.

The first is the idea that our knowledge is not just a set of facts, but is organized into theories that help us understand the world. We call these theories intuitive theories – they are the explanatory frameworks that people carry with them to understand why things happen. What follows from this idea is that when you want to change people’s behavior, you can’t just tell them to change or tell them different facts. You need to change their theory. When I want Madeline to eat her vegetables, it turns out just telling her to “eat broccoli” doesn’t work very well – even if she does eat the broccoli, she won’t know what else to eat or why to eat it. And of course the well-known idea about fostering a growth mindset is precisely this kind of implicit theory: it’s a theory of whether ability is fixed or whether it can be improved with hard work.

The second idea I want to share is that our judgment is systematically biased. It’s biased by our own beliefs. Our minds are wonderful, efficient systems that deal with uncertainty – we piece together a sentence even in a noisy restaurant using our expectations about what that person might be trying to say to us. In most cases, this is an amazing feature of our own cognition, letting us operate flexibly using limited data. But this reliance on our own beliefs also has negative consequences: it leads us to stereotype, and to engage in confirmation bias, looking for evidence that further supports our own beliefs. Understanding of these sources of bias can help us avoid falling into this trap. A good grounding in psychology, in other words, helps us be more aware of our own limitations.

I’d love to tell you about more ideas. Every woodworker loves to show off their workbench. And the wonderful thing about tools is that when you use them together you can create new tools, in the same way the carpenter can first make a jig to make it easier to make a difficult cut. I could go on, but hopefully I’ve piqued your curiosity – and you have lots more to do today.

5. So. Make sure that you celebrate! Eat some cake, smash a piñata, and most of all, say your "thank you"s to the people who have supported you during your time here at Stanford. I speak for all of them when I say that we are very proud of you and cannot wait to see what you accomplish.

As this weekend passes and you head off for other things, it is all but certain that you will find yourself in new situations facing challenges that you have not considered before. (Life would not be fun without them!). But I am confident that your tools will be sufficient to the job. Keep them sharp and they will serve you well.


Saturday, May 5, 2018

nosub: a command line tool for pushing web experiments to Amazon Mechanical Turk

(This post is co-written with Long Ouyang, a former graduate student in our department, who is the developer of nosub, and Manuel Bohn, a postdoc in my lab who has created a minimal working example). 

Although my lab focuses primarily on child development, our typical workflow is to refine experimental paradigms via working with adults. Because we treat adults as a convenience population, Amazon Mechanical Turk (AMT) is a critical part of this workflow. AMT allows us to pay an hourly wage to participants all over the US who complete short experimental tasks. (Some background from an old post).

Our typical workflow for AMT tasks is to create custom websites that guide participants through a series of linguistic stimuli of one sort or another. For simple questionnaires we often use Qualtrics, a commercial survey product, but most tasks that require more customization are easy to set up as free-standing javascript/HTML sites. These sites then need to be pushed to AMT as "external HITs" (Human Intelligence Tasks) so that workers can find them, participate, and be compensated. 

nosub is a simple tool for accomplishing this process, building on earlier tools used by my lab.* The idea is simple: you customize your HIT settings in a configuration file and type

nosub upload

to upload your experiment to AMT. Then you can type

nosub download

to fetch results. Two nice features of nosub from a psychologist's perspective are: 1. worker IDs are anonymized by default so you don't need to worry about privacy issues (but they are deterministically hashed so you can still flag repeat workers),  and 2. nosub can post HITs in batches so that you don't get charged Amazon's surcharge for tasks with more than 9 hits. 

All you need to get started is to install Node.js; installation instructions for nosub are available in the project repository.

Once you've run nosub, you can download your data in JSON format, which can easily be parsed into R. We've put together a minimal working example of an experiment that can be run using nosub and a data analysis script in R that reads in the data.  

---
psiTurk is another framework that provides a way of serving and tracking HITs. psiTurk is great and we have used it for heavier-weight applications where we need to track participants, but can be tricky to debug and is not always compatible with some of our light-weight web experiments.

Monday, February 26, 2018

Mixed effects models: Is it time to go Bayesian by default?

(tl;dr: Bayesian mixed effects modeling using brms is really nifty.)

Introduction: Teaching Statistical Inference?

How do you reason about the relationship between your data and your hypotheses? Bayesian inference provides a way to make normative inferences under uncertainty. As scientists – or even as rational agents more generally – we are interested in knowing the probability of some hypothesis given the data we observe. As a cognitive scientist I've long been interested in using Bayesian models to describe cognition, and that's what I did much of my graduate training in. These are custom models, sometimes fairly difficult to write down, and they are an area of active research. That's not what I'm talking about in this blogpost. Instead, I want to write about the basic practice of statistics in experimental data analysis.

Mostly when psychologists do and teach "stats," they're talking about frequentist statistical tests. Frequentist statistics are the standard kind people in psych have been using for the last 50+ years: t-tests, ANOVAs, regression models, etc. Anything that produces a p-value. P-values represent the probability of the data (or any more extreme) under the null hypothesis (typically "no difference between groups" or something like that). The problem is that this is not what we really want to know as scientists. We want the opposite: the probability of the hypothesis given the data, which is what  Bayesian statistics allow you to compute. You can also compute the relative evidence for one hypothesis over another (the Bayes Factor).  

Now, the best way to set psychology twitter on fire is to start a holy war about who's actually right about statistical practice, Bayesians or frequentists. There are lots of arguments here, and I see some merit on both sides. That said, there is lots of evidence that much of our implicit statistical reasoning is Bayesian. So I tend towards the Bayesian side on the balance <ducks head>. But despite this bias, I've avoided teaching Bayesian stats in my classes. I've felt like, even with their philosophical attractiveness, actually computing Bayesian stats had too many very severe challenges for students. For example, in previous years you might run into major difficulties inferring the parameters of a model that would be trivial under a frequentist approach. I just couldn't bring myself to teach a student a philosophical perspective that – while coherent – wouldn't provide them with an easy toolkit to make sense of their data.  

The situation has changed in recent years, however. In particular, the BayesFactor R package by Morey and colleagues makes it extremely simple to do basic inferential tasks using Bayesian statistics. This is a huge contribution! Together with JASP, these tools make the Bayes Factor approach to hypothesis testing much more widely accessible. I'm really impressed by how well these tools work. 

All that said, my general approach to statistical inference tends to rely less on inference about a particular hypothesis and more on parameter estimation – following the spirit of folks like Gelman & Hill (2007) and Cumming (2014). The basic idea is to fit a model whose parameters describe substantive hypotheses about the generating sources of the dataset, and then to interpret these parameters based on their magnitude and the precision of the estimate. (If this sounds vague, don't worry – the last section of the post is an example). The key tool for this kind of estimation is not tests like the t-test or the chi-squared. Instead, it's typically some variant of regression, usually mixed effects models. 

Mixed-Effects Models

Especially in psycholinguistics where our experiments typically show many people many different stimuli, mixed effects models have rapidly become the de facto standard for data analysis. These models (also known as hierarchical linear models) let you estimate sources of random variation ("random effects") in the data across various grouping factors. For example, in a reaction time experiment some participants will be faster or slower (and so all data from those particular individuals will tend to be faster or slower in a correlated way). Similarly, some stimulus items will be faster or slower and so all the data from these groupings will vary. The lme4 package in R was a game-changer for using these models (in a frequentist paradigm) in that it allowed researchers to estimate such models for a full dataset with just a single command. For the past 8-10 years, nearly every paper I've published has had a linear or generalized linear mixed effects model in it. 

Despite their simplicity, the biggest problem with mixed effects models (from an educational point of view, especially) has been figuring out how to write consistent model specifications for random effects. Often there are many factors that vary randomly (subjects, items, etc.) and many other factors that are nested within those (e.g., each subject might respond differently to each condition). Thus, it is not trivial to figure out what model to fit, even if fitting the model is just a matter of writing a command. Even in a reaction-time experiment with just items and subjects as random variables, and one condition manipulation, you can write

(1) rt ~ condition + (1 | subject) + (1 |  item)

for just random intercepts by subject and by item, or you can nest condition (fitting a random slope) for one or both:

(2) rt ~ condition + (condition | subject) + (condition |  item)

and you can additionally fiddle with covariance between random effects for even more degrees of freedom!

Luckily, a number of years ago, a powerful and clear simulation paper by Barr et al. (2013) came out. They argued that there was a simple solution to the specification issue: use the "maximal" random effects structure supported by the design of the experiment. This meant adding any random slopes that were actually supported by your design (e.g., if condition was a within-subject variable, you could fit condition by subject slopes). While this suggestion was quite controversial,* Barr et al.'s simulations were persuasive evidence that this suggestion led to conservative inferences. In addition, having a simple guideline to follow eliminated a lot of the worry about analytic flexibility in random effects structure. If you were "keeping it maximal" that meant that you weren't intentionally – or even inadvertently – messing with your model specification to get a particular result. 

Unfortunately, a new problem reared its head in lme4: convergence. With very high frequency, when you specify the maximal model, the approximate inference algorithms that search for the maximum likelihood solution for the model will simply not find a satisfactory solution. This outcome can happen even in cases where you have quite a lot of data – in part because the number of parameters being fit is extremely high. In the case above, not counting covariance parameters, we are fitting a slope and an intercept across participants, plus a slope and intercept for every participant and for every item

To deal with this, people have developed various strategies. The first is to do some black magic to try and change the optimization parameters (e.g., following these helpful tips). Then you start to prune random effects away until your model is "less maximal" and you get convergence. But these practices mean you're back in flexible-model-adjustment land, and vulnerable to all kinds of charges of post-hoc model tinkering to get the result you want. We've had to specify lab best-practices about the order for pruning random effects – kind of a guide to "tinkering until it works," which seems suboptimal. In sum, the models are great, but the methods for fitting them don't seem to work that well. 

Enter Bayesian methods. For several years, it's been possible to fit Bayesian regression models using Stan, a powerful probabilistic programming language that interfaces with R. Stan, building on BUGS before it, has put Bayesian regression within reach for someone who knows how to write these models (and interpret the outputs). But in practice, when you could fit an lmer in one line of code and five seconds, it seemed like a bit of a trial to hew the model by hand out of solid Stan code (which looks a little like C: you have to declare your variable types, etc.). We have done it sometimes, but typically only for models that you couldn't fit with lme4 (e.g., an ordered logit model). So I still don't teach this set of methods, or advise that students use them by default. 

brms?!? A worked example

In the last couple of years, the package brms has been in development. brms is essentially a front-end to Stan, so that you can write R formulas just like with lme4 but fit them with Bayesian inference.* This is a game-changer: all of a sudden we can use the same syntax but fit the model we want to fit! Sure, it takes 2-3 minutes instead of 5 seconds, but the output is clear and interpretable, and we don't have all the specification issues described above. Let me demonstrate. 

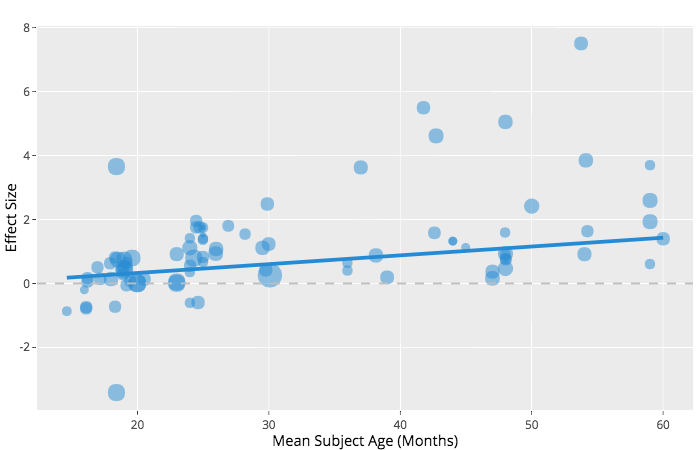
The dataset I'm working on is an unpublished set of data on kids' pragmatic inference abilities. It's similar to many that I work with. We show children of varying ages a set of images and ask them to choose the one that matches some description, then record if they do so correctly. Typically some trials are control trials where all the child has to do is recognize that the image matches the word, while others are inference trials where they have to reason a little bit about the speaker's intentions to get the right answer. Here are the data from this particular experiment:


I'm interested in quantifying the relationship between participant age and the probability of success in pragmatic inference trials (vs. control trials, for example). My model specification is:

(3) correct ~ condition * age + (condition | subject) + (condition | stimulus)

So I first fit this with lme4. Predictably, the full desired model doesn't converge, but here are the fixed effect coefficients: 

                      beta       stderr  z        p
intercept             0.50 0.19 2.65 0.01
condition             2.13 0.80 2.68 0.01
age                   0.41 0.18 2.35 0.02
condition:age        -0.22 0.36 -0.61 0.54
Now let's prune the random effects until the convergence warning goes away. In the simplified version of the dataset that I'm using here I can keep stimulus and subject intercepts and still get convergence when there are no random slopes. But in the larger dataset, the model won't converge unless i do just the random intercept by subject:

                      beta       stderr  z        p
intercept             0.50 0.21 2.37 0.02
condition             1.76 0.33 5.35 0.00
age                   0.41 0.18 2.34 0.02
condition:age        -0.25 0.33 -0.77 0.44

Coefficient values are decently different (but the p-values are not changed dramatically in this example, to be fair). More importantly, a number of fairly trivial things matter to whether the model converges. For example, I can get one random slope in if I set the other level of the condition variable to be the intercept, but it doesn't converge with either in this parameterization. And in the full dataset, the model wouldn't converge at all if I didn't center age. And then of course I haven't tweaked the optimizer or messed with the convergence settings for any of these variants. All of this means that there are a lot of decisions about these models that I don't have a principled way to make – and critically, they need to be made conditioned on the data, because I won't be able to tell whether a model will converge a priori!

So now I switched to the Bayesian version using brms, just writing brm() with the model specification I wanted (3). I had to do a few tweaks: upping the number of iterations (suggested by the warning messages from the output, changing to a Bernoulli model rather than binomial (for efficiency, again suggested by the error message), but this was very straightforward otherwise. For simplicity I've adopted all the default prior choices, but I could have gone more informative.

Here's the summary output for the fixed effects:

                      estimate  error    l-95% CI u-95% CI
intercept             0.54      0.48    -0.50     1.69
condition             2.78      1.43     0.21     6.19
age                   0.45      0.20     0.08     0.85
condition:age        -0.14      0.45    -0.98     0.84

From this call, we get back coefficient estimates that are somewhat similar to the other models, along with 95% credible interval bounds. Notably, the condition effect is larger (probably corresponding to being able to estimate a more extremal value for the logit based on sparse data), and then the interaction term is smaller but has higher error. Overall, coefficients look more like the first non-convergent maximal model than the second converging one. 

The big deal about this model is not that what comes out the other end of the procedure is radically different. It's that it's not different. I got to fit the model I wanted, with a maximal random effects structure, and the process was almost trivially easy. In addition, and as a bonus, the CIs that get spit out are actually credible intervals that we can reason about in a sensible way (as opposed to frequentist confidence intervals, which are quite confusing if you think about them deeply enough). 

Conclusion

Bayesian inference is a powerful and natural way of fitting statistical models to data. The trouble is that, up until recently, you could easily find yourself in a situation where there was a dead-obvious frequentist solution but off-the-shelf Bayesian tools wouldn't work or would generate substantial complexity. That's no longer the case. The existence of tools like BayesFactor and brms means that I'm going to suggest that people in my lab go Bayesian by default in their data analytic practice. 

----
Thanks to Roger Levy for pointing out that model (3) above could include an age | stimulus slope to be truly maximal. I will follow this advice in the paper. 

* Who would have thought that a paper about statistical models would be called "the cave of shadows"?
** Rstanarm did this also, but it covered fewer model specifications and so wasn't as helpful. 

Tuesday, January 16, 2018

MetaLab, an open resource for theoretical synthesis using meta-analysis, now updated

(This post is jointly written by the MetaLab team, with contributions from Christina Bergmann, Sho Tsuji, Alex Cristia, and me.)


A typical “ages and stages” ordering. Meta-analysis helps us do better.

Developmental psychologists often make statements of the form “babies do X at age Y.” But these “ages and stages” tidbits sometimes misrepresent a complex and messy research literature. In some cases, dozens of studies test children of different ages using different tasks and then declare success or failure based on a binary p < .05 criterion. Often only a handful of these studies – typically those published earliest or in the most prestigious journals – are used in reviews, textbooks, or summaries for the broader public. In medicine and other fields, it’s long been recognized that we can do better.

Meta-analysis (MA) is a toolkit of techniques for combining information across disparate studies into a single framework so that evidence can be synthesized objectively. The results of each study are transformed into a standardized effect size (like Cohen’s d) and are treated as a single data point for a meta-analysis. Each data point can be weighted to reflect a given study’s precision (which typically depends on sample size). These weighted data points are then combined into a meta-analytic regression to assess the evidential value of a given literature. Follow-up analyses can also look at moderators – factors influencing the overall effect – as well as issues like publication bias or p-hacking.* Developmentalists will often enter participant age as a moderator, since meta-analysis enables us to statistically assess how much effects for a specific ability increase as infants and children develop. 


An example age-moderation relationship for studies of mutual exclusivity in early word learning.

Meta-analyses can be immensely informative – yet they are rarely used by researchers. One reason may be because it takes a bit of training to carry them out or even understand them. Additionally, MAs go out of date as new studies are published. 

To facilitate developmental researchers’ access to up-to-date meta-analyses, we created MetaLab. MetaLab is a website that compiles MAs of phenomena in developmental psychology. The site has grown over the last two years from just a small handful of MAs to 15 at present, with data from more than 16,000 infants. The data from each MA are stored in a standardized format, allowing them to be downloaded, browsed, and explored using interactive visualizations. Because all analyses are dynamic, curators or interested users can add new data as the literature expands.