Monday, December 14, 2015

The ManyBabies Project

tl;dr: Introducing and organizing a ManyLabs study for infancy research. Please comment or email me (mcfrank (at) stanford.edu) if you would like to join the discussion list or contribute to the project. 

Introduction

The last few years have seen increasing acknowledgement that there are flaws in the published scientific literature – in psychology and elsewhere (e.g., Ioannidis, 2005). Even more worrisome is that self-corrective processes are not as fast or as reliable as we might hope. For example, in the reproducibility project, which was published this summer (RPP, project page here), 100 papers were sampled from top journals, and one replication of each was conducted. This project revealed a disturbingly low rate of success for seemingly well-powered replications. And even more disturbing, although many of the target papers had a large impact, most still had not been replicated independently seven years later (outside of RPP). 

I am worried that the same problems affect developmental research. The average infancy study – including many I've worked on myself – has the issues we've identified in the rest of the psychology literature: low power, small samples, and undisclosed analytic flexibility. Add to this the fact that many infancy findings are never replicated, and even those that are replicated may show variable results across labs. All of these factors lead to a situation where many of our empirical findings are too weak to build theories on.

In addition, there is a second, more infancy-specific problem that I am also worried about. Small decisions in infancy research – anything from the lighting in the lab to whether the research assistant has a beard – may potentially affect data quality, because of the sensitivity of infants to minor variations in the environment. In fact, many researchers believe that there is huge intrinsic variability between developmental labs, because of unavoidable differences in methods and populations (hidden moderators). These beliefs lead to the conclusion that replication research is more difficult and less reliable with infants, but we don't have data that bear one way or the other on this question.

Wednesday, November 25, 2015

Preventing statistical reporting errors by integrating writing and coding

tl;dr: Using RMarkdown with knitr is a nice way to decrease statistical reporting errors.

How often are there statistical reporting errors in published research? Using a new automated method for scraping APA-formatted stats out of PDFs, Nuijten et al. (2015) found that over 10% of p-values were inconsistent with the reported details of the statistical test, and 1.6% were what they called "grossly" inconsistent, e.g. difference between the p-value and the test statistic meant that one implied statistical significance and the other did not (another summary here). Here are two key figures, first for proportion inconsistent by article and then for proportion of articles with an inconsistency:


These graphs are upsetting news. Around half of articles had at least one error by this analysis, which is not what you want from your scientific literature.* Daniel Lakens has a nice post suggesting that three errors account for many of the problems: incorrect use of < instead of =, use of one-sided tests without clear reporting as such, and errors in rounding and reporting.

Speaking for myself, I'm sure that some of my articles have errors of this type, almost certainly from copying and pasting results from an analysis window into a manuscript (say Matlab in the old days or R now).**  The copy-paste thing is incredibly annoying. I hate this kind of slow, error-prone, non-automatable process.

So what are we supposed to do? Of course, we can and should just check our numbers, and maybe run statcheck (the R package Nuijten et al. created) on our own work as well. But there is a much better technical solution out there: write statistics into the manuscript in one executable package that automatically generates the figures, tables, and statistical results. In my opinion, doing this used to be almost as much of a pain as doing the cutting and pasting (and this is spoken as someone who writes academic papers in LaTeX!). But now the tools for writing text and code together have gotten so good that I think there's no excuse not to. 


Thursday, November 5, 2015

A conversation about scale construction

(Note: this post is joint with Brent Roberts and Michael Kraus, and is cross-posted on their blogs - MK and BR).

MK: Twitter recently rolled out a polling feature that allows its users to ask and answer questions of each other. The poll feature allows polling with two possible response options (e.g., Is it Fall? Yes/No). Armed with snark and some basic training in psychometrics and scale construction, I thought it would be fun to pose the following as my first poll:


Said training suggests that, all things being equal, some people are more “Yes” or more “No” than others, so having response options that include more variety will capture more of the real variance in participant responses. To put that into an example, if I ask you if you agree with the statement: “I have high self-esteem.” A yes/no two-item response won’t capture all the true variance in people’s responses that might be otherwise captured by six items ranging from strongly disagree to strongly agree. MF/BR, is that how you would characterize your own understanding of psychometrics?

MF: Well, when I’m thinking about dependent variable selection, I tend to start from the idea that the more response options for the participant, the more bits of information are transferred. In a standard two-alternative forced-choice (2AFC) experiment with balanced probabilities, each response provides 1 bit of information. In contrast, a 4AFC provides 2 bits, an 8AFC provides 3, etc. So on this kind of reasoning, the more choices the better, as illustrated by this table from Rosenthal & Rosnow’s classic text:


For example, in one literature I am involved in, people are interested in the ability of adults and kids to associate words and objects in the presence of systematic ambiguity. In these experiments, you see several objects and hear several words, and over time the ideas is that you build up some kind of links between objects and words that are consistently associated. In these experiments, initially people used 2 and 4AFC paradigms. But as the hypotheses about mechanism got more sophisticated, people shifted to using more stringent measures, like a 15AFC, which was argued to provide more information about the underlying representations.

On the other hand, getting more information out of such a measure presumes that there is some underlying signal. In the example above, the presence of this information was relatively likely because participants had been trained on specific associations. In contrast, in the kinds of polls or judgment studies that you’re talking about, it’s more unknown whether participants have the kind of detailed representations that allow for fine-grained judgements. So if you’re asking for a judgment in general (like in #TwitterPolls or classic likert scales), how many alternatives should you use?

MK: Right, most or all of my work (and I imagine a large portion of survey research) involves subjective judgments where it isn’t known exactly how people are making their judgments and what they’d likely be basing those judgments on. So, to reiterate your own question: How many response alternatives should you use?

MF: Turns out there is some research on this question. There’s a very well-cited paper by Preston & Coleman (2000), who ask about a service rating scale for restaurants. Not the most psychological example, but it’ll do. They present different participants with different numbers of response categories, ranging from 2 - 101. Here is their primary finding:


In a nutshell, the reliability is pretty good for two categories, but it gets somewhat better up to about 7-9 options, then goes down somewhat. In addition, scales with more than 7 options are rated as slower and harder to use. Now this doesn’t mean that all psychological constructs have enough resolution to support 7 or 9 different gradations, but at least simple ratings or preference judgements seem like they might.

MK: This is great stuff! But if I’m being completely honest here, I’d say the reliabilities for just two response categories, even though they aren’t as good as they are at 7-9 options, are good enough to use. BR, I’m guessing you agree with this because of your response to my Twitter Poll:


BR: Admittedly, I used to believe that when it came to response formats, more was always better. I mean, we know that dichotomizing continuous variables is bad, so how could it be that a dichotomous rating scale (e.g., yes/no) would be as good if not superior to a 5-point rating scale? Right?

Two things changed my perspective. The first was precipitated by being forced to teach psychometrics, which is minimally on the 5th level of Dante’s Hell teaching-wise. For some odd reason at some point I did a deep dive into the psychometrics of scale response formats and found, much to my surprise, a long and robust history going all they way back to the 1920s. I’ll give two examples. Like the Preston & Colemen (2000) study that Michael cites, some old old literature had done the same thing (god forbid, replication!!!). Here’s a figure showing the test-retest reliability from Matell & Jacoby (1971), where they varied the response options from 2 to 19 on measures of values:


The picture is a little different from the internal consistencies shown in Preston & Colemen (2000), but the message is similar. There is not a lot of difference between 2 and 19. What I really liked about the old school researchers is they cared as much about validity as they did reliability--here’s their figure showing simple concurrent validity of the scales:


The numbers bounce a bit because of the small samples in each group, but the obvious take away is that there is no linear relation between scale points and validity.

The second example is from Komorita & Graham (1965). These authors studied two scales, the evaluative dimension from the Semantic Differential and the Sociability scale from the California Psychological Inventory. The former is really homogeneous, the latter quite heterogeneous in terms of content. The authors administered 2 and 6 point response formats for both measures. Here is what they found vis a vis internal consistency reliability:


This set of findings is much more interesting. When the measure is homogeneous, the rating format does not matter. When it is heterogeneous, having 6 options leads to better internal consistency. The authors’ discussion is insightful and worth reading, but I’ll just quote them for brevity: “A more plausible explanation, therefore, is that some type of response set such as an “extreme response set” (Cronbach, 1946; 1950) may be operating to increase the reliability of heterogeneous scales. If the reliability of the response set component is greater than the reliability of the content component of the scale, the reliability of the scale will be increased by increasing the number of scale points.”

Thus, the old-school psychometricians argued that increasing the number of scale point options does not affect test-retest reliability, or validity. It does marginally increase internal consistency, but most likely because of “systematic error” such as, response sets (e.g., consistently using extreme options or not) that add some additional internal consistency to complex constructs.

One interpretation of our modern love of multi-option rating scales is that it leads to better internal consistencies which we all believe to be a good thing. Maybe it isn’t.

MK: I’ve have three reactions to this: First, I’m sorry that you had to teach psychometrics. Second, it’s amazing to me that all this work on scale construction and optimal item amount isn’t more widely known. Third, how come, knowing all this as you do, this is the first time I have heard you favor two-item response options?

BR: You might think that I would have become quite the zealot for yes/no formats after coming across this literature, but you would be wrong. I continued pursuing my research efforts using 4 and 5 point rating scales ad nauseum. Old dogs and new tricks and all of that.

The second experience that has turned me toward using yes/no more often, if not by default, came as a result of working with non-WEIRD [WEIRD = White, Educated, Industrial, Rich, and Democratic] samples and being exposed to some of the newer, more sophisticated approaches to modeling response information in Item Response Theory. For a variety of reasons our research of late has been in samples not typically employed in most of psychology, like children, adolescents, and less literate populations than elite college students. In many of these samples, the standard 5-point likert rating of personality traits tend to blow up (psychometrically speaking). We’ve considered a number of options for simplifying the assessment to make it less problematic for these populations to rate themselves, one of which is to simplify the rating scale to yes/no.

It just so happens that we have been doing some IRT work on an assessment experiment we ran on-line where we randomly assigned people to fill out the NPI in one of three conditions--the traditional paired-comparison, a 5-point likert ratings of all of the stems, and a yes/no rating of all of the NPI item stems (here’s one paper from that effort). I assumed that if we were going to turn to a yes/no format that we would need more items to net the same amount of information as a likert-style rating. So, I asked my colleague and collaborator, Eunike Wetzel, how many items you would need using a yes/no option to get the same amount of test information from a set of likert ratings of the NPI. IRT techniques allow you to estimate how much of the underlying construct a set of items captures via a test information function. What she reported back was surprising and fascinating. You get the same amount of information out of 10 yes/no ratings as you do out of 10 5-point likert scale ratings of the NPI.

So, Professor Kraus, this is the source of the pithy comeback to your tweet. It seems to me that there is no dramatic loss of information, reliability, or validity when using 2-point rating scales. If you consider the benefits gained--responses will be a little quicker, fewer response set problems, and the potential to be usable in a wider population, there may be many situations in which a yes/no is just fine. Conversely, we may want to be cautious about the gain in internal consistency reliability we find in highly verbal populations, like college students, because it may arise through response sets and have no relation to validity.

MK: I appreciate this really helpful response (and that you address me so formally). Using a yes/no format has some clear advantages, as it forces people to fall on one side of a scale or the other, is quicker to answer than questions that rely on 4-7 Likert items, and sounds (from your work BF) that it allows scales to hold up better for non-WEIRD populations. MF, what is your reaction to this work?

MF: This is totally fascinating. I definitely see the value of using yes/no in cases where you’re working with non-WEIRD populations. We are just in the middle of constructing an instrument dealing with values and attitudes about parenting and child development and the goal is to be able to survey broader populations than the university-town parents we often talk to. So I am certainly convinced that yes/no is a valuable option for that purpose and will do a pilot comparison shortly.

On the other hand, I do want to push back on the idea that there are never cases where you would want a more graded scale. My collaborators and I have done a bunch of work now using continuous dependent variables to get graded probabilistic judgments. Two examples of this work are Kao et al., (2014) – I’m not an author on that one but I really like it – and Frank & Goodman (2012). To take an example, in the second of those papers we showed people displays with a bunch of shapes (say a blue square, blue circle, and green square) and asked them, if someone used the word “blue,” which shape do you think they would be talking about?

In those cases, using sliders or “betting” measures (asking participants to assign dollar values between 0 and 100) really did seem to provide more information per judgement than other measures. I’ve also experimented with using binary dependent variables in these tasks, and my impression is that they both converge to the same mean, but that the confidence intervals on the binary DV are much larger. In other words, if we hypothesize in these cases that participants really are encoding some sort of continuous probability, then querying it in a continuous way should yield more information.

So Brent, I guess I’m asking you whether you think there is some wiggle room in the results we discussed above – for constructs and participants where scale calibration is a problem and psychological uncertainty is large, we’d want yes/no. But for constructs that are more cognitive in nature, tasks that are more well-specified, and populations that are more used to the experimental format, isn’t it still possible that there’s an information gain for using more fine-grained scales?

BR: Of course there is wiggle room. There are probably vast expanses of space where alternatives are more appropriate. My intention is not to create a new “rule of thumb” where we only use yes/no responses throughout. My intention was simply to point out that our confidence in certain rules of thumb is misplaced. In this case, the assumption that likert scales are always preferably is clearly not the case. On the other hand, there are great examples where a single, graded dimension is preferable--we just had a speaker discussing political orientation which was rated from conservative to moderate to liberal on a 9-point scale. This seems entirely appropriate. And, mind you, I have a nerdly fantasy of someday creating single-item personality Behaviorally Anchored Rating Scales (BARS). These are entirely cool rating scales where the items themselves become anchors on a single dimension. So instead of asking 20 questions about how clean your room is, I would anchor the rating points from “my room is messier than a suitcase packed by a spider monkey on crack” to “my room is so clean they make silicon memory chips there when I’m not in”. Then you could assess the Big Five or the facets of the Big Five with one item each. We can dream can’t we?

MF: Seems like a great dream to me. So - it sounds like if there’s one take-home from this discussion, it’s “don’t always default to the seven-point likert scale.” Sometimes such scales are appropriate and useful, but sometimes you want fewer – and maybe sometimes you’d even want more.

Wednesday, October 7, 2015

Language helps you find out just how weird kids are

My daughter M, my wife, and I were visiting family on the east coast about a month ago. One night, M was whining a little bit before bedtime, and after some investigation, my wife figured out that M's pajamas – a new lighter-weight set that we brought because the weather was still hot – were bothering her. The following dialogue ensued:
Mom: "are your pajamas bothering you?"
M: "yah."
Mom: "are they hurting you, sweetie?"
M: "yaaah!"
Mom: "where do they hurt you?"
M: "'jamas hurt mine face!"
Now I don't know where M went wrong in this exchange – does she not understand "pajamas," "hurt," or "face," or does she just think that hurting your face is the ultimate insult? – but there's clearly something different in her understanding of the situation than we expected. One more example, from when I returned from a trip to the mountains last week ("dada go woods!"):
M: "my go woods see dove!"
me: "yeah? you want to see a dove?"
M: "see dove in my ear!"
me: "in your ear?"
M: "dove go in my ear go to sleep."
me: "really?"
M: "dove going to bed."
M is now officially a two-year-old (26 months), and it's been a while since I wrote about her – in part because I am realizing as I teach her the ABCs that it won't be that long before she can read what I write. But these exchanges made me think about two things. First, her understanding of the world, though amazing, is still very different then mine (there are many other examples besides the painful pajamas and the dove in her ear). And second, it's her rapidly-growing ability with language that allows her to reveal these differences.

Children spend a short, fascinating time in what's been called the "two-word stage." There was an interesting discussion of this stage on the CHILDES listserv recently; whatever your theoretical take, it's clear that children's early productions are fragmentary and omit more than they include. Because of these omissions, this kind of language requires the listener to fill in the gaps. If a child says "go store," she could be saying that she wants to go to the store, or commanding you to go to the store. If she says "my spill," you have to figure out what it is she just spilled (or wants permission to spill).

Since the listener plays such a big role in understanding early language productions, they are plausible by definition. There's almost no way for the child to express a truly weird sentiment, because the adult listener will tend to fill in the gaps in the utterance with plausible materials. (This can be quite frustrating for a child who really wants to say something weird.) M's language, in contrast, is now at the stage where she can express much more complex meanings, albeit with significant grammatical errors. So in some sense, this is the first chance I've had to find out just how weird her view of the world really is.

Friday, October 2, 2015

Can we improve math education with a 5000-year-old technology?

(This post is written jointly by my collaborator David Barner and me; we're posting it to both his new blog, MeaningSeeds, and to mine). 

The first calculating machines invented by humans – stone tablets with grooves that contained counting stones or "calculi" – are no match for contemporary computers in terms of computational power. But they and their descendants, in the form of the modern Soroban abacus, may have an edge on modern techniques when it comes to mathematics education. In a study about to appear in Child Development, co-authored with George AlvarezJessica Sullivan, and Mahesh Srinivasan, we investigated a recent trend in math education that emanates from these first counting boards: The use of "mental abacus."

The abacus, which originates from Babylonian counting boards dating back to at least 2700 BC, has been used in a dozen different cultures in different forms for tallying, accounting, and basic arithmetic procedures like addition, subtraction, multiplication and division. And recently, it has made a comeback in classrooms in around the world, as a supplement to K-12 elementary mathematics. The most popular form of abacus – the Japanese Soroban (pictured below) – features a collection of beads arranged into vertical columns, each of which represents a place value – ones, tens, hundreds, thousands, etc. At the bottom of each column are four "earthly" beads, each of which represents a multiple of 1. On top is one "heavenly" bead, which represents a multiple of 5. When beads are moved toward the dividing beam, they are "in play", such that each column can represent a value up to 9.

When children learn mental abacus, they first are taught to represent numbers on the physical device, and then to add and subtract quantities by moving beads in and out of play. After some months of practice, they are then asked to do sums by simply imagining an abacus, rather than using the actual physical device. This mental version of the abacus has clear – and sometimes profound – computational benefits for some expert users. Highly trained users – called "masters" by those in the abacus world – can instantly encode and recall long strings of numberscan add two digit numbers as fast as they can be called out in sequence, and can compute square roots – and even cube roots – almost instantaneously, even for large numbers. Most startling of all, these techniques can be practices while simultaneously talking, and can be mastered by children as young as 10 years of age with record breaking results (see also herehere, and here).  If you haven’t ever seen this phenomenon, take a look at the YouTube video below. It is truly remarkable stuff. 


In our study we asked whether this technique can be mastered to good effect by ordinary school children, in big, busy, modern classrooms. We conducted the research in Vadodara, India, a medium sized industrial town on the west coast of India, where abacus has recently become a popular supplement to standard math training in both after-school and standard K-12 settings. At the charitable school we visited, abacus training was already underway and was being taught to hundreds of children starting in Grade 2, in classrooms of 70 children per group. To see whether it was having a positive effect, we enrolled a new, previously untrained, cohort of roughly 200 Grade 2 kids and randomly assigned them to receive either abacus training from expert teachers or extra hours of standard math training, in addition to their regular math curriculum.

Even in these relatively large classrooms of children from low-income families, mental abacus technique edged out standard math. Though effects were modest in this group, they were reliable across multiple measures of math ability. Also, children attained the best mastery of mental abacus best if they began the study with strong spatial working memory abilities (to get a sense of how we measured spatial working memory take a look at this video).

Why did abacus have this positive effect? One possibility is that learning a different way of representing numbers helped kids make generalizations about how numbers work. For example, the abacus – like other math manipulatives – provides a concrete representation of place value – i.e., the idea that the same digit can represent a different quantity depending on its position (e.g., the first and second 3 in “33” represent 30 and 3 respectively). This better representation might have helped kids understand the conceptual basis of arithmetic. Another possibility is that the edge was chiefly due to the highly procedural nature of mental abacus training. Operations are initially learned as sequences of hand movements, rather than as linguistic rules, and according to users can be performed almost automatically, without reflection. Finally, it's possible that it's this unique mix of conceptual concreteness and procedural efficacy that gives the abacus its edge. Children may not have to learn procedures and then separately learn how these operations relate to objects and sets in the world: Abacus may allow both to be learned at the same time, a welcome tonic to the ongoing math wars.  

Right now it's uncertain why mental abacus helps kids, and whether the effects we've found will last beyond early elementary school. Also, the technique has yet to be rigorously tested on US shores, where it's currently being adopted by public schools in at least two states. This is the focus of a new study, currently underway, which will test whether this ancient calculation technique should be left in museums, or instead be widely adopted to boost math achievement in the 21st century.

Wednesday, September 30, 2015

Descriptive vs. optimal bayesian modeling

In the past fifteen years, Bayesian models have fast become one of the most important tools in cognitive science. They have been used to create quantitative models of psychological data across a wide variety of domains, from perception and motor learning all the way to categorization and communication. But these models have also had their critics, and one of the recurring critiques of the models has been their entanglement with claims that the mind is rational or optimal. How can optimal models of mind be right when we also have so much evidence for the sub-optimality of human cognition?*

An exciting new manuscript by Tauber, Navarro, Perfors, and Steyvers makes a provocative claim: you can give up on the optimal foundations of Bayesian modeling and still make use of the framework as an explicit toolkit for describing cognition.** I really like this idea. For the last several years, I've been arguing for decoupling optimality from the Bayesian project. I even wrote a paper called "throwing out the Bayesian baby with the optimal bathwater" (which was about Bayesian models of baby data, clever right?).

In this post, I want to highlight two things about the TNPS paper, which I generally really liked and enjoyed reading. First, it contains an innovative fusion of Bayesian cognitive modeling and Bayesian data analysis. BDA has been a growing and largely independent strand of the literature; fusing BDA with cognitive models makes a lot of really rich new theoretical development possible. Second, it contains two direct replications that succeed spectacularly, and it does so without making any fuss whatsoever – this is, in my view, what observers of the "replication crisis" should be aspiring to.

1. Bayesian cognitive modeling meets Bayesian data analysis.

The meat of the TNPS paper revolves around three case studies in which they use the toolkit of Bayesian data analysis to fit cognitive models to rich experimental datasets. In each case they argue that taking an optimal perspective – in which the structure of the model is argued to be normative relative to some specified task – is overly restrictive. Instead, they specify a more flexible set of models with more parameters. Some settings of these parameters may be "suboptimal" for many tasks but have a better chance of fitting the human data. And the fitted parameters of these models then can reveal aspects of how human learners treat the data – for example, how heavily they weight new observations or what sampling assumptions they make.

This fusion of Bayesian cognitive modeling and Bayesian data analysis is really exciting to me because it allows the underlying theory to be much more responsive to the data. I've been doing less cognitive modeling in recent years in part because my experience was that my models weren't as responsive as I liked to the data that I and others collected. I often came to a point where I would have to do something awful to my elegant and simple cognitive model in order to make it fit the human data.

One example of this awfulness comes from a paper I wrote on word segmentation. We found that an optimal model from the computational linguistics literature did a really good job fitting human data - if you assumed that it observed data equivalent to something between a tenth and a hundredth of the data the humans observed. I chalked this problem up to "memory limitations" but didn't have much more to say about it. In fact, nearly all my work on statistical learning has included some kind of memory limitation parameter, more or less – a knob that I'd twiddle to make the model look like the data.***

In their first case study, TNPS estimate the posterior distribution of this "data discounting" parameter as part of their descriptive Bayesian analysis. That may not seem like a big advance from the outside, but in fact it opens the door to putting into place much more psychologically-inspired memory models as part of the analytic framework. (Dan Yurovsky and I played with something a bit like this in a recent paper on cross-situational word learning – where we estimated a power-law memory decay on top of an ideal observer word learning model – but without the clear theoretical grounding that TNPS). I would love to see this kind of work really try to understand what this sort of data discounting means, and how it integrates with our broader understanding of memory.

2. The role of replication.

Something that flies completely under the radar in this paper is how closely TNPS replicate the previous empirical findings reported. Their Figure 1 tells a great story:


Panel (a) shows the original data and model fits from Griffiths & Tenenbaum (2007), and panel (b) shows their own data and replicated fits. This is awesome. Sure, the model doesn't perfectly fit the data - and that's TNPS's eventual point (along with a related point about individual variation). But clearly GT measured a true effect, and they measured it with high precision.

The same thing was true of Griffiths & Tenenbaum (2006) – the second case study in TNPS. GT2006 was a study about estimating conditional distributions for different processes, e.g. given that you've lived X years, how likely is it that you live Y. At the risk of belaboring the point, I'll show you three datasets on this question. First from GT2006, second from TNPS, and third a new, unreported dataset from my replication class a couple of years ago.**** The conditions (panels) are plotted in different orders in each plot, but if you take the time to trace one, say lifespans or poems, you will see just how closely these three datasets replicate one another. Not just the shape of the curve but also the precise numerical values:


This result is the ideal outcome to strive for in our responses to the reproducibility crisis. Quantitative theory requires precise measurement - you just can't get anywhere fitting a model to a small number of noisily estimated conditions. So you have to strive to get precise measures – and this leads to a virtuous cycle. Your critics can disagree with your model precisely because they have a wealth of data to fit their more complex models to (that's exactly TNPS's move here).

I think it's no coincidence that quite a few of the first big data, mechanical turk studies I saw were done by computational cognitive scientists. Not only were they technically oriented and happy to port their experiments to the web, they also were motivated by a severe need for more measurement precision. And that kind of precision leads to exactly the kind of reproducibility we're all striving for.

---
* Think Tversky & Kahneman, but there are many many issues with this argument...
** Many thanks to Josh Tenenbaum for telling me about the paper; thanks also to the authors for posting the manuscript.
*** I'm not saying the models were in general overfit to the data – just that they needed some parameter that wasn't directly derived from the optimal task analysis.
**** Replication conducted by Calvin Wang.

Monday, September 14, 2015

Marr's attacks and more: Discussion of TopiCS special issue

In David Marr's pioneering book, Vision, he proposed that no single analysis provides a complete understanding of an information processing device. Instead, you really need to have a theory at three different levels, answering three different sets of questions; only together do these three analyses constitute a full understanding. Here's his summary of the three levels of analysis that he proposed:


Since 1982 when the book came out, this framework has been extremely influential in cognitive science, but it has also spurred substantial debate. One reason these debates have been especially noticeable lately is due to the increasing popularity of Bayesian approaches to cognitive science, which are often posed as analyses at the computational theory level. Critiques of Bayesian approaches (e.g., Jones & Love; Bowers & Davis; Endress; Marcus & Davies) often take implicit or explicit aim at computational theory analyses, claiming that they neglect critical psychological facts and that analyses at only the computational level run the risk of being unconstrained "just so" stories.*

In a recent special issue of Topics in Cognitive Science, a wide variety of commentators re-examined the notion of levels of analysis. The papers range from questioning of the utility of separate levels all the way to proposals of new, intermediate levels. Folks in my lab were very interested in the topic, so we split up the papers amongst us and each read one, with everyone reading this nice exposition by Bechtel & Shagrir.  The papers vary widely, and I haven't read all of them. That said, the lab meeting discussion was really interesting and so I thought I would summarize three points from it that made contact with several of the articles.

1. The role of iteration between levels in the practice of research. 

Something that felt missing from a lot of the articles we read was a sense of the actual practice of science. There was a lot of talk about the independence of levels of analysis or the need for other levels (e.g., in rational process models). But something I didn't see at all in the articles we discussed was any notion of how these philosophical stances would interact with the day-to-day practice of science. In my own work, I often iterate between hypotheses about cognitive constraints (e.g., memory and attention) and the actual structure of the information processing mechanisms I'm interested in. If I predict a particular effect and then I don't observe it, I often wonder if my task was too demanding cognitively. I'll then try to test that question by removing some sort of memory demand.

An example of this strategy comes from a paper I wrote a couple of years ago. I had noticed several important "failures" in artificial language learning experiments and wondered the extent to which these should be taken as revealing hard limits on our learning abilities, or whether they were basically just results of softer memory constraints. So I tried to reproduce the same learning problems in contexts with more limited constraints, e.g. by giving participants unlimited access to the stimulus materials in an audio loop or even a list of sentences written on index cards. For some problems, this manipulation was all it took to raise performance to ceiling level. But other problems were still fairly difficult for many learners even when they could see all the materials laid out in front of them! This set of findings then allowed me to distinguish which phenomena were a product of memory demands and which might constrain the representation or computation beyond those processing limitations.**

2. The differences between rational analysis and computational level analysis. 

I'm a strong proponent of the view that a computational level analysis that uses normative or optimal (e.g. Bayesian) inference tools doesn't have to imply that the agent is optimal. In a debate a couple of years ago about an infant learning model I made, I tried to separate the baggage of rational analysis from the useful tools that come from the computational level examination of the task that the agent faces. The article was called "throwing out the Bayesian baby with the optimal bathwater," and it still summarizes my position on the topic pretty well. But I didn't see this distinction between rational analysis and computational level analysis being made consistently in the special issue articles I looked at.

I generally worry that critiques of the computational level tend to end up leveling arguments against rational analysis instead, because of its stronger optimality assumptions. In contrast, the ideal observer framework – which is used much more in perception studies – is a way of posing computational level analyses that doesn't presuppose that the actual observer is ideal. Rather, the ideal observer is a model that is created to make ideal use of the available information; the output of this model can then be compared to the empirical data, and its assumptions can be rejected when they do not fit performance. I really like the statement of this position that's given in this textbook chapter by William Geisler.

3. The question of why representation should be grouped with algorithm. 

I had never really thought about this before, perhaps because it'd been a while since I went back to Marr. Marr calls level 2 "representation and algorithm." If we reflect on the modern practice of probabilistic cognitive modeling, that label doesn't work at all – we almost always describe the goal of computational level analysis as discovering the representation. Consider Kemp & Tenenbaum's "discovery of structural form" – this paper is a beautiful example of representation-finding, and is definitely posed at the highest level of analysis.

Maybe here's one way to think about this issue: Marr's idea of representation in level 2 was that the scientist took for granted that many representations of a stimulus were possible and was interested in the particular type that best explained human performance. In contrast, in a lot of the hard problems that probabilistic cognitive models get applied to – physical simulation, social goal inference, language comprehension, etc. – the challenge is to design any representation that in principle has the expressivity to capture the problem space. And that's really a question of understanding what the problem is that's being solved, which is after all the primary goal of computational level analysis on Marr's account.

Conclusions.

My own take on Marr's level's is much more pragmatic than the majority of authors in the special issue. I tend to see the levels as a guide for different approaches, perhaps more like Dennett's stances than like true ontological distinctions. An investigator can try on whichever one seems like it will give the most leverage on the problem at hand, and swapping or discarding a level in a particular case doesn't require reconsidering your ideological commitments. From that perspective, it has always seemed rather odd or shortsighted for people to critique someone on the level of analysis they are interested in at the moment. A more useful move is just to point out a phenomenon that their theorizing doesn't explain...

---
* Of course, we also have plenty of responses to these critiques....
** I'm painfully aware that this discussion presupposes that there is some distinction between storage and computation, but that's a topic for another day perhaps.

Thanks to everyone in the lab for a great discussion – Kyle MacDonald, Erica Yoon, Rose Schneider, Ann Nordmeyer, Molly Lewis, Dan Yurovsky, Gabe Doyle, and Okko Räsänen.

ResearchBlogging.org

Peebles, D., & Cooper, R. (2015). Thirty Years After Marr's : Levels of Analysis in Cognitive Science Topics in Cognitive Science, 7 (2), 187-190 DOI: 10.1111/tops.12137

Monday, August 31, 2015

The slower, harder ways to increase reproducibility

tl;dr: The second of a two part series. Recommendations for improving reproducibility – many require slowing down or making hard decisions, rather than simply following a different rule than you followed before.

In my previous post, I wrote about my views on some proposed changes in scientific practice to increase reproducibility. Much has been made of preregistration, publication of null results, and Bayesian statistics as important changes to how we do business. But my view is that there is relatively little value in appending these modifications to a scientific practice that is still about one-off findings; and applying them mechanistically to a more careful, cumulative practice is likely to be more of a hindrance than a help. So what do we do? Here are the modifications to practice that I advocate (and try to follow myself).

1. Cumulative study sets with internal replication. 

If I had to advocate for a single change to practice, this would be it. In my lab we never do just one study on a topic, unless there are major constraints of cost or scale that prohibit that second study. Because one study is never decisive.* Build your argument cumulatively, using the same paradigm, and include replications of the key effect along with negative controls. This cumulative construction provides "pre-registration" of analyses – you need to keep your analytic approach and exclusion criteria constant across studies. It also gives you a good intuitive estimate of the variability of your effect across samples. The only problem is that it's harder and slower than running one-off studies. Tough. The resulting quality is orders of magnitude higher. 

If you show me a one-off study and I fail to replicate it in my lab, I will tend to suspect that you got lucky or p-hacked your way to a result. But if you show me a package of studies with four internal replications of an effect, I will believe that you know how to get that effect – and if I don't get it, I'll think that I'm doing something wrong. 

2. Everything open by default.

There is a huge psychological effect to doing all your work knowing that everyone will see all your data, your experimental stimuli, and your analyses. When you're tempted to write sloppy, uncommented code, you think twice. Unprincipled exclusions look even more unprincipled when you have to justify each line of your analysis.** And there are incredible benefits of releasing raw stimuli and data – reanalysis, reuse, and error checking. It can make you feel very exposed to have all your experimental data subject to reanalysis by reviewers or random trolls on the internet. But if there is an obvious, justifiable reanalysis that A) you didn't catch and B) provides evidence against your interpretation, you should be very grateful if someone finds it (and even more so if it's before publication).  

3. Larger N. 

Increasing sample sizes is a basic starting point that almost every study could benefit from. Simmons et al. (2011) advocated N=20 per cell then realized that was far too few; Vazire asks for 200, perhaps with her tongue in her cheek. I'm pretty darn sure there's no magic number. Psychophysics studies might need a dozen (or 59). Individual differences studies might need 10,000 or more. But if there's one thing we've learned from the recent focus on statistical power, estimating any effect accurately requires much more power than we expect. My rough guide is that the community standards for N in each subfield are almost always off by at least a factor of 2, just in terms of power for statistical significance. And they are off by a factor of 10 for collecting effect size estimates that will support model-based inferences.

4. Better visualizations of variability. 

If you run a lot of studies, show all of their results together in one big plot. And show us the variability of those measurements in a way that allows us to understand how much precision you have. Then we will know whether you really have evidence that you understand and whether you can consistently predict either the existence or the magnitude of an effect. Use 95% CIs or Bayesian credible intervals or HPD intervals or whatever strikes your fancy. Frequentist CIs do perform badly when you have just a handful of datapoints, but they do fine when N is large (see above). But come on: this one is obvious: Standard error of the mean is a terrible guide to inference. I care much less about frequentist or Bayesian and much, much more about whether it's 95% vs. 68%. 

5. Manipulation checks, positive controls, and negative controls. 

The reproducibility project was a huge success, and I'm very proud to have been part of it. But I felt that one intuition about replicability was missing from the assessment of the results: whether the experimenters thought they could have "fixed" the experiment. Meaning, there are some findings that when they fail to replication, you have no recourse – you have no idea what to do next. The original paper found a significant effect and a decent effect size, you find nothing. But there are other experiments where you know what happened, based on the pattern of results: the manipulation failed, or the population was different, or the baseline didn't work. In these studies, you typically know what to do next – strengthen the manipulation, alter the stimuli for the population, modify the baseline.

The paradigms you can "debug" – repeat iteratively to adjust them for your situation or population – typically have a number of internal controls. These usually include manipulation checks, positive controls, or negative controls (sometimes even all three). Manipulation checks tell you that the manipulation had the desired effect – e.g., if you are inducing people to identify with a particular group, they actually do, or if you are putting people under cognitive load they are actually under load. Negative controls show that in the absence of the manipulation there is no difference in the measure – they are a sanity check that other aspects of the experimental situation are not causing your effect. Positive controls tell you that some manipulation can cause a difference in your measure, hence it is a sensitive measure, even if the manipulation of interest fails. The output of these checks can provide a wealth of information about a failure to replicate and can lead to later successes.

6. Predictions from (quantitative) theory.

If all of our theories are vague, verbal one-offs then they provide very little constraint on our empirical measures. That's a terrible situation to be in as a scientist. If we can create quantitative theories that make empirical predictions, then these theories provide strong constraints on our data – if we don't observe a predicted pattern, we need to rethink either the model or the experiment. While neither one is guaranteed to be right, the theory provides an extra check on the data. I wrote more about this idea here.

7. A broader portfolio of publication outlets.

If every manipulation psychologists conducted were important, then we'd want to preregister and publish all of our findings. This situation is – arguably – the case in biomedicine. Every trial is a critical part of the overall outlook on a given drug, and most trials are expensive and risky, so they require regulation and care. But, like it or not, experimental psychology is different. Our work is cheap and typically poses little risk to participants, and there are an infinity of possible psychological manipulations that don't do anything and may never be of any importance.

So, as I've been arguing in previous posts, I think it's silly to advocate that psychologists publish all of their (null) results. There are plenty of reasons not to publish a null result: boringness, bad design, evidence of experimenter error, etc. Of course, there are some null results that are theoretically important and in those cases, we absolutely should publish. But my own research would grind to a halt if I had to write up all the dumb and unimportant things that I've pursued and dropped in the past few years.***

What we need is a broader set of publication outlets that allow us to publish all of the following: exciting new breakthroughs; theoretically deep, complex study sets; general incremental findings; run-of-the-mill replications; and messy, boring, or null results. No one journal can be the right home for all of these. In my view, there's a place for Science and Nature – or some idealized, academically-edited, open-access version of them. I love reading and writing short, broad, exciting reports of the best work on a topic. But there's also a place for journals where the standard is correctness and the reports can include whatever level of detail is necessary to document messy, boring, or null findings that nevertheless will be useful to others going forward. Think PLoS ONE, perhaps without the high article publication charge. The broader point is that we need a robust ecosystem of publication outlets – from high-profile to run-of-the-mill – and some of these outlets need to allow for publication of null results. But whether we publish in them should be a matter of our own scientific responsibility. 

Conclusions.

A theme running throughout all these recommendations is that I generally believe in all of the principles advocated by folks who want prereg, publication of nulls, and Bayesian data analysis. But their suggestions are almost always posed as mechanical rules: rules that you can follow and know that you are doing science the right way. But these rules should be tempered by our judgment. Preregister if you think that previous work doesn't sufficiently constrain analysis. Publish nulls if they are theoretically important. Use Bayesian tools if they afford some analytic advantages relative to their complexity. But don't do these things just because someone said to. Do them because – in your best scientific judgment – they improve the reliability and validity of the argument you are making.

-----
Thanks to Chris Potts for valuable discussion. Typos corrected afternoon 8/31.

* And, I don't know about you, but when I can only do one study, I always get it wrong. 
** I especially like this one: data <- data[data$subid != "S011",]. Damn you, subject 11.
*** I also can't think of anything more boring than reading Studies 1 – 14 in my paper titled "A crazy idea about word learning that never really should have worked anyway and, in the end, despite a false positive in Study 3, didn't amount to anything."

Thursday, August 27, 2015

A moderate's view of the reproducibility crisis

(Part 1 of a series of two blogposts on this topic. The second part is here.)

Reproducibility is a major problem in psychology and elsewhere. Much of the published literature is not solid enough to build on: experiences from my class suggest that students can get interesting stuff to work about half the time, at best. The recent findings of the reproducibility project only add to this impression.* And awareness has been growing about all kinds of potential problems for reproducibility, including p-hacking, file-drawer effects, and deeper issues in the frequentist data analysis tools many of us were originally trained on. What we should do about this problem?

Many people advocate dramatic changes to our day-to-day scientific practices. While I believe deeply in some of these changes – open practices being one example – I also worry that some recommendations will hinder the process of normal science. I'm what you might call a "reproducibility moderate." A moderate acknowledges the problem, but believes that the solutions should not be too radical. Instead, solutions should be chosen to conserve the best parts of our current practice.

Here are my thoughts on three popular proposed solutions to the reproducibility crisis: preregistration, publication of null results, and Bayesian statistics. In each case, I believe these techniques should be part of our scientific arsenal – but adopting them wholesale would cause more problems than it would fix.

Pre-registration. Pre-registering a study is an important technique for removing analytic degrees of freedom. But it also ties the analysts's hands in ways that can be cumbersome and unnecessary early in a research program, where analytic freedom is critical for making sense of the data (the trick is just not to publish those exploratory analyses as though they are confirmatory). As I've argued, preregistration is a great tool to have in your arsenal for large-scale or one-off studies. In cases where subsequent replications are difficult or overly costly, prereg allows you to have confidence in your analyses. But in cases where you can run a sequence of studies that build on one another, each replicating the key finding and using the same analysis strategy, you don't need to pre-register because your previous work naturally constrains your analysis. So: rather than running more one-off studies but preregistering them, we should be doing more cumulative, sequential work where – for the most part – preregistration isn't needed.

Publication of null findings. File drawer biases – where negative results are not published and so effect sizes are inflated across a literature – are a real problem, especially in controversial areas. But the solution is not to publish everything, willy-nilly! Publishing a paper, even a short one or a preprint, is a lot of work. The time you spend writing up null results is time you are not doing new studies. What we need is thoughtful consideration of when it is ethical to suppress a result, and when there is a clear need to publish.

Bayesian statistics. Frequentist statistical methods have deep conceptual flaws and are broken in any number of ways. But they can still be a useful tool for quantifying our uncertainty about data, and a wholesale abandonment of them in favor of Bayesian stats (or even worse, nothing!) risks several negative consequences. First, having a uniform statistical analysis paradigm facilitates evaluation of results. You don't have to be an expert to understand someone's ANOVA analysis. But if everyone uses one-off graphical models (as great as they are), then there are many mistakes we will never catch due to the complexity of the models. Second, the tools for Bayesian data analysis are getting better quickly, but they are nowhere near as easy to use as the frequentist ones. To pick on one system, as an experienced modeler, I love working with Stan. But until it stops crashing my R session, I will not recommend it as a tool for first-year graduate stats. In the mean time, I favor the Cumming solution: A more gentle move towards confidence intervals, judicious use of effect size, and a decrease in reliance on inferences from individual instances of p < .05.

Sometimes it looks like we've polarized into two groups: replicators and everyone else. This is crazy! Who wants to spend an entire career replicating other people's work, or even your own? Instead, replication needs to be part of our scientific process more generally. It needs to be a first step, where we build on pre-existing work, and a last step, where we confirm our findings prior to publication. But the steps in the middle – where you do the real discovery – are important as well. If we focus only on those first and last steps and make our recommendations in light of them alone, we forget the basic practice of science.

----
* I'm one of many, many authors of that project, having helped to contribute four replication projects from my graduate class.

Tuesday, July 14, 2015

Engineering the National Children's Study

The National Children's Study was a 100,000-child longitudinal study that would have tracked a cohort of children from birth to age 21, measuring environmental, family, genetic, and cognitive aspects of development at an unprecedented scale. Unfortunately, last year the NIH Director decided to shut the study down, following a highly critical report from the National Academy of Sciences that criticized a number of aspects of the study including its leadership and its sampling plan.

I got involved in the NCS about a year ago, when I was asked to be a part of the Cognitive Health team. Participating in the team has been an extremely positive experience, as I've had a chance to work with a great group of developmental researchers. We've met weekly for the past year, first to create plans for the cognitive portions of NCS, and later – after the study was cancelled – to discuss possible byproducts of the group's work. (Full disclosure: I am still a contractor for NCS and will be until the final windup is completed).

According to recent reports, though, NCS may be restarted by an act of Congress. As originally conceived, the study served a very valuable purpose: creating a sample large enough and diverse enough to allow analyses of rare outcomes, even for parts of the population that are often underrepresented in other cohorts. Other countries clearly think this is a good ideaAccording to one proposal, though, recruitment in the new study might piggyback on other ongoing studies. I'm not sure how this could work, given that different studies would likely have radically different measures, ages, and recruitment strategies. Even if some of these choices were coordinated, differences in implementation of the studies would make inferences from the data much more problematic.

I would love to see the original NCS vision carried to fruition. But even based on my limited perspective, I also understand why the project was extremely slow to start and ran into substantial cost obstacles. Creating such a massive design inevitably runs into problems of interlocking constraints, where decisions about recruitment depend on decisions about design and vice versa. Converging on the right measures is such a difficult process that by the time decisions are made, they are already out of date (a critique leveled also by the NAS report).

If the NCS is restarted, it will need a faster and cheaper planning process to have a chance of going forward to data collection. Here's my proposal: the NCS needs to work as if it's building a piece of software, not planning a conference. If you're planning a conference, you need to have stakeholders gradually reach consensus on details like the location, the program, and the events, before a single event occurs on a fixed timeline. But if you're building a software application, you need to respond to the constraints of your platform, adapt to your shifting user base, pilot test quickly and iteratively, and make sure that everything works before you release to market. This kind of agile optimization was missing from the previous iteration of the study. Here are three specific suggestions.

1. Iterative piloting. 

Nothing reveals the weaknesses of a study design like putting it into practice.  In a longitudinal study, the adoption of a bad measure, bad data storage platform, or bad sampling decision early on in the study will dramatically reduce the value of the subsequent data. It's a terrible feeling to collect data on a measure, knowing that the earlier baselines were flawed and the longitudinal analysis will be compromised.

The original NCS included a vanguard cohort of about 5,000 participants, mostly to test the recruitment strategy. (In fact, the costs of the vanguard study may have contributed to the cancelation of the main strategy). But one pilot program is not enough. All aspects of the program need to be piloted, so that the design can be adapted to the realities of the situation. From the length of the individual sessions, to the reliability of the measures and the retention rate across different populations, critical parts of the study all need to be tested multiple times before they are adopted.

The revised NCS should create a staged series of pilot samples of gradually increasing size, whose timeline is designed to allow iteration and incorporation of insights from previous samples. For example, if NCS v2 launches in 2022, then create cohorts of 100, 200, 1000, and 2000 to launch in 2018 – 21, respectively. Make the first samples longitudinal to test dropout (so the sampling design can be adjusted in the main study), and make the last sample cross-sectional so as to pilot test the precise measures that are planned for every age visit. Make it a rule: If 
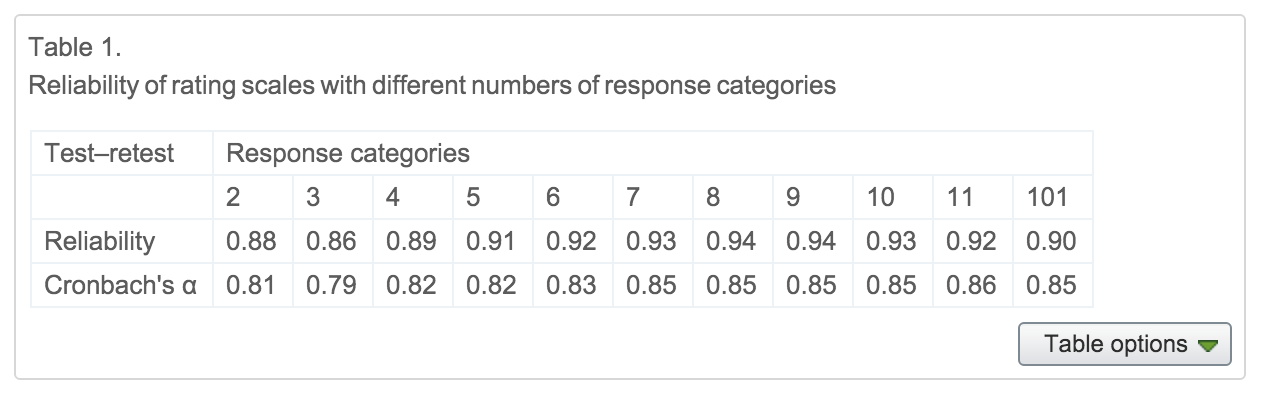
any measure or decision is adopted in the final sample, there must be data on its reliability in the current study context.

2. Early adoption of precise infrastructure standards.  

Here's a basic example of an interlocking constraint satisfaction problem. You need to present measures to parents and collect and store the data resulting from these measures in a coherent data-management framework. But the way you collect the data and the way you store them interact with what the measures are. You can't know exactly how data from a measure (even one as simple as a survey) will look until you know how it will be collected. But you want to design the infrastructure for data collection around the measures that you need.

One way to solve this kind of problem is to iterate gradually into a solution. One committee discusses measures, a second discusses infrastructure. They discuss their needs, then meet, then discuss their needs again. Finally they converge and adopt a shared standard. This model can work well if the target you are optimizing to is static, e.g. if the answer stays the same during your deliberations. The problem is that technical infrastructure doesn't stay the same while you work – the best infrastructure is constantly changing. Good ideas for data management when the NCS began are no longer relevant. But if the infrastructure group is constantly changing the platform, then the folks creating the measures can't ever rely on particular functionality.

Software engineers solve this problem by creating design specifications that are implementation independent. In other words, everyone knows exactly what they need to deliver and what they can rely on others to deliver (and the under-the-hood details don't matter). Consider an API (application programming interface) for an eye-tracker. The experimenter doesn't know how the eye-tracker measures point of gaze, but she knows that if she calls a particular method, say getPointOfGaze, she will get back X and Y coordinates, accurate to some known tolerance. On the other end of the abstraction, the eye-tracker manufacturers don't need to know the details of the experiment in order to build the eye-tracker. They just need to getPointOfGaze quickly and accurately.

In a revised NCS, study architects should publish a technical design specification for all (behavioral) measures that is independent of method of administration. Such standards obviate hiring many layers of contractors to implement each set of measures separately. Instead, a single format conversion step can be engineered. For example, a standard survey XML format would be translated into the appropriate presentation format (whether the survey is presented on the phone, on the computer, or on a tablet or phone). As in many modern content management systems, the users of a measure could rapidly view and iterate on the precise implementation of the measure, rather than having to work through intermediaries.

A further engineering trick that could be applied to this setup is the use of automated testing and test suites. Given a known survey format and a uniform standard, it would be far easier to create automated tools to estimate completion time, to test data storage and integrity, and to search for bugs. Imagine if the NCS looked like an open-source software project, in which each "build" of the study protocol would be forced to pass a set of automated tests prior to piloting...

3. Independence of measure development and measure adoption.

Other people's children are great, but we all love our own the best. That's why we don't review our own papers or hire our own PhD students to be our colleagues. The adoption of measures into a longitudinal study is no different. If we allow the NCS to engage in measure development – creating new ways of measuring a particular environmental, physiological, or psychological construct – rather than simply adopting pre-existing standards, we need to take care that these measures are only adopted if they are the best option for fulfilling the study's goals.

Fix this problem by barring NCS designers from being involved in the creation of measures that are then used in the NCS. If the design committee wants a new measure, they must solicit competitive outside bids to create it and then adopt the version that has the most data supporting it in a direct evaluation. To do otherwise risks the inclusion of measures with insufficient evidence of reliability and validity.

This recommendation is based directly on my own experiences in the Cognitive Health team. Over the course of the last year, I've been very pleased to be able to help this team in the development of a new set of measures for profiling infant cognition. Based on automated eye-tracking methods, these measures have the potential to be a ground-breaking advance in understanding individual differences in cognition during infancy. I'm now quite invested in their success and I hope to continue working on them regardless of the outcome of the NCS study.

That's precisely the problem. I am no longer an objective observer of these measures! Had NCS gone forward I would have pushed for their adoption into the main study, even if the data on their efficacy were much more limited than should be necessary for adoption at a national scale. I'm not suggesting that NCS would adopt a really terrible measure. But given what we know about motivated cognition and the sunk cost fallacy, it's very likely that the bar would be lower for adopting an internally-developed measure than an external one.

If the NCS acts as a developer of new measures, there is a temptation to continue working to get the perfect suite of measurements, rather than to stop development and run the study. This is the great being the enemy of the good. If the NCS is a consumer of others' measures – on some rare occasions, measures that it has commissioned and evaluated – then it can more dispassionately adopt the best available option that fits the constraints of the study.

Conclusions

My own experiences with the NCS – limited as they are – have been nothing but positive. I've gotten to work with some great people, seen the initial development of an exciting new tool, and glimpsed the workings of a much larger project. But as I read about the fate of the study as a whole, I worry that the independence that's made my little part of the project so fun to work on – developing standards, envisioning new measures – is precisely why the project as a whole did not move forward.

What I've suggested here is that a new version of the NCS could benefit from an engineering mindset. Having internal deadlines for pilot launches would constrain planning with interim goals. Adding precise technical specifications and the abstractions necessary to work with them would add certainty to the planning process and eliminate many redundant contractors; for example, our new measures would probably be off the table simply because they wouldn't fit into the existing infrastructure. And an adversarial review of measures would better allow designers to weigh independent evidence for adoption.

In sum: bring back the NCS! But run it like you're building an app: one that has to fulfill a set of functions, yes, but also one that has to scale quickly and cheaply to unprecedented size.

---
Thanks to Steve Reznick, my colleague on the Cognitive Health team, for valuable comments on a previous draft. Views and errors are my own.  

Friday, July 10, 2015

New postdoc opportunity

(Update as of September, 2015: Position is now filled.)

My lab, the Language and Cognition Lab in the Psych Department at Stanford, is recruiting a postdoctoral fellow for a new project.

Parents are increasingly bombarded with information about how they should parent, often in terse formats like public service messages, brief videos, or even texts. But what do they take away from these messages? To answer this question, we're starting a new project on the pragmatics of communicating about parenting. Drawing on research in pedagogy, cognitive development, pragmatics, and social cognition, we will investigate what parents with different backgrounds learn from parenting messages, and how these messages affect their interactions with their children. Within this general framework there will be substantial room for developing an independent research program. 

We anticipate that this work will involve experiments with both adults and children. Start date is flexible (though fall would be preferred); the position is for one year initially, with the possibility of renewal. For more information about the lab, see our website at langcog.stanford.edu.

If you are interested in applying, please send a cover letter including the names of three references, a CV, and a PDF of a paper that you feel represents your best work to rschneid@stanford.edu. Review of applications will start immediately and continue until the position is filled. 

Sunday, July 5, 2015

Does "time out" hurt your brain?

A recent article in Time Magazine by Daniel Siegel and Tina Payne Bryson argues that "time out" – a disciplinary method that replaces spanking or other physical punishment with enforced social disengagement – is causing harm to children. Siegel and Bryson are authors of The Whole Brain Child, a recent parenting handbook.

Siegel and Bryson make their case using a very weird style of dualistic rhetoric. This is a part and parcel of The Whole Brain Child, whose tagline asks "Do children conspire to make their parents’ lives endlessly challenging? No―it’s just their developing brain calling the shots!" (Personally, I thought it was their spleen.)

Consider this quote from their Time piece:
Studies in neuroplasticity—the brain’s adaptability—have proved that repeated experiences actually change the physical structure of the brain. Since discipline-related interactions between children and caregivers comprise a large amount of childhood experiences, it becomes vital that parents thoughtfully consider how they respond when kids misbehave.
The consequent of this argument – be thoughtful about discipline – seems absolutely true, and practically tautological. It's the first antecedent – the bit about the physical structure of the brain – that worries me. Are we only worried about physical organs? What about the mind, or even the soul? Without some extra premise, for example "...and the physical structure of the brain is more important than what it does," the first part is almost unrelated to the rest of the argument.

Similarly, "In a brain scan, relational pain—that caused by isolation during punishment—can look the same as physical abuse. Is alone in the corner the best place for your child?" The rhetoric is the same: a factual statement about brain science is paired with a statement about parenting, despite their limited relationship to one another. And although relational pain can be incredibly powerful (a couple of years ago, Atul Gawande wrote a wonderful piece on whether solitary confinement should be considered torture), the reason why we believe this has nothing to do with reverse inferences about what the brain shows. It has to do with the behavioral consequences of isolation.

I haven't yet made up my mind about time out. Some parents we know practice it regularly and their children seem fine (though I haven't looked at their brains to make sure they are not physically damaged). And the American Academy of Pediatrics' disciplinary recommendations include a qualified recommendation of time out, with some evidence of efficacy for both older and younger kids. M isn't yet two, and luckily we mostly haven't had too many issues of her acting out – but I can imagine that I wouldn't rule out time out as a punishment.  

More generally, Siegel and Bryson's rhetoric stems from the basic premise that children should be maximally protected from all forms of pain or even discomfort.  Is it better to allow children to have some negative experiences, whether administered by a loving parent or randomly stumbled into? Or should we keep these experiences from them as long as possible, on the thinking that they will have to have them eventually and it is better to establish childhood as a time of greater safety? Though I haven't made up my mind, I think lean towards less protection than Siegel and Bryson do. But it is very frustrating – perhaps even dishonest – to conceal such a critical issue in a fog of brain rhetoric.

Monday, June 29, 2015

A one-trial replication of Chemla & Spector (2011)

tl;dr: Replication of a somewhat controversial finding in experimental semantics/pragmatics.

How do we go beyond the literal semantics of what someone says to infer what they actually meant? Pragmatic inferences – inferences about language use in context – are an important part of language comprehension, and one of the topics I'm most interested in these days. The case study for much of the experimental work on pragmatics has been scalar implicature (in fact, I taught an entire course on this topic last winter). For example, if I say "some of the students passed the test," you can infer that some but not all of the students passed the test. (If I had meant "all passed the test," I probably would have said that).

Although these have been taken as canonical examples of pragmatic inferences, things have gotten a bit more complicated in recent years. A number of linguists have argued that these implicatures are actually generated automatically and are part of the grammar, rather than being generated based on expectations about speakers' intended meanings in context. I won't review the whole literature on this issue (it's quite complicated) but one particularly important phenomenon in the debate is the existence of what are called "local" scalar implicatures – that is, implicatures that are generated within an utterance rather than at the level of the entire utterance.

Here's an example, from a very nice paper by Chemla & Spector (2011). C&S showed participants displays like these:


Then they asked participants to make a graded judgment about the truth of sentences with respect to these pictures. The key sentence (translated into English, the original was in French) is "Exactly one letter is connected with some of its circles." Critically, the different pictures were designed so as to be congruent with different interpretations of the experimental items. C&S posited three such readings:

  • "literal" reading: "exactly one circle is connected with some or all of its circles" (C&S say that the others also must be connected with none, but I'm not sure why);
  • "local" reading: "exactly one circle is connected with some but not all of its circles"
  • "global" reading: "exactly one circle is connected with some but not all of its circles, the others are connected with none"

The local interpretation was the critical one for their purposes, because it required the scalar implicature within the sentence (strengthening "some" to "some but not all") but no implicature at the global level, e.g. that the others are connected with none. As an experimental linking hypothesis, they claimed that participants' degree of truth judgment would be proportional to the number of readings that a particular picture supported. As shown above, the different displays that they used rendered different combinations of readings true.

C&S found data that strongly supported the availability of local readings. In fact, the local reading was even stronger than the literal reading (this wasn't necessarily a prediction, but made their case stronger):


This experimental finding has been controversial, however. Geurts & van Tiel (2014), following previous work by Geurts that didn't find embedded (local) implicatures, have critiqued this and other papers. And a paper I was involved in, Potts et al. (under review), has a much more extensive take on this issue, as well as a different, more naturalistic paradigm.

But in addition to theoretical questions, every time I talk to people about the C&S finding, they bring up doubts about the paradigm that C&S used, whether various replications show order effects, and whether this effect is general across languages (in French, the original language, their "some of its" was certain de, which isn't even a quantifier, technically). In this post, I'm reporting what I say to people when they mention these worries. In particular, I have replicated C&S's basic finding several times in various classes, often in ways that address the critiques above. Here I'll present a version I ran last summer for a course at ESSLLI 2014.

This was a class demo of Amazon Mechanical Turk, so my method was extremely basic. I took exactly the four images above and showed them to four independent groups of 50 US-based participants (total N = 200), who made judgments about whether the target sentence was true of the picture using a seven-point likert scale. So this was a one-trial, completely between-subjects design. Note that there were two manipulation checks relating to descriptions of the display (31 participants failed), and we excluded 39 more for doing more than one trial. Final N was 130.

Here are the data, with 95% CIs:


We replicate the finding that local implicatures were available at detectable levels (e.g., ratings clearly better than those for false sentences). The magnitude is different from C&S, though: the sentences were judged to be far better for the literal pictures than the local ones. Another interesting aspect of this discussion has been about various different response formats. As I mentioned, we used a 7-point likert scale, but participants essentially only used the endpoints (as in the Potts et al. paper above). It seems that participants either "see" a reading or don't. They don't seem to be finding multiple readings and judging the picture to match the sentence to a certain extent, or at least they are not doing this in any substantial number. Here's the histogram:


In sum, we replicate Chemla & Spector, in English, with a standard likert scale, without any fillers, order effects, or extra items to be compared against one another. Some – but not all – participants found an interpretation consistent with local scalar implicature. Code and data available here